CHINA fertilizer exports reached $83.9 billion in 2024, marking an 8.9% YoY decline from $92.1 billion in 2023. This contraction follows a robust 51% compound growth over 2020-2024, during which exports surged from $55.6 billion. Fertilizers remain critical agricultural inputs for global food security.
1. Leading Export Nations
The top six exporters accounted for 53.2% of global value:
-
Russia: $13.9B (16.6%)
-
China: $8.5B (10.1%)
-
Canada: $6.7B (8.0%)
-
Morocco: $5.4B (6.4%)
-
USA: $5.2B (6.2%)
-
Saudi Arabia: $5.0B (5.9%)
Collective market share decreased marginally from 53.3% in 2023.
2. Regional & Product Breakdown
| Region | Value ($B) | % Share | Product Category | % Share |
|---|---|---|---|---|
| Europe | 30.6 | 36.4% | Nitrogen-Based | 75.3% |
| Asia | 27.9 | 33.3% | Potash | 19.7% |
| North America | 12.2 | 14.5% | Phosphate | 3.5% |
| Africa | 11.0 | 13.1% | Animal/Vegetable | 1.5% |
3. Top 30 Exporters: Growth Dynamics
| Country | 2024 Value ($B) | YoY Change | Key Driver |
|---|---|---|---|
| UAE | 0.832 | +2361% | Russia trade rerouting |
| Belarus | 1.16 | -43.8% | EU sanctions |
| China | 8.50 | -12.4% | Export controls |
2025 China Fertilizer Export Outlook: Strategic Shifts
1. Policy-Driven Export Framework
-
Quota System:
-
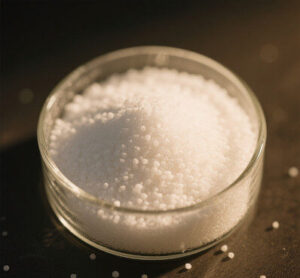
Urea exports capped at 5 MMT (+78.6% vs 2024)
-
Phosphate exports restricted to May-Sept window
-
-
Green Compliance:
-
EU CBAM to add $80-100/t cost to urea shipments
-
Leading producers (e.g., Yuntianhua) adopting green ammonia tech (52% carbon reduction)
-
2. Regional Market Strategy
| Target | Growth Lever | Challenge |
|---|---|---|
| Southeast Asia | – Vietnam/Indonesia demand ↑22% – Logistics advantage |
Local production expansion |
| Africa | – 30 MMT demand gap – Zero-tariff access (90% goods) |
Port infrastructure |
| Latin America | Brazilian soybean boom | US competition |
3. Competitive Positioning
-
Cost Leadership:
-
Yunnan phosphate cluster cuts production cost by 15%
-
-
Differentiation:
-
Kingenta’s controlled-release tech (NUE>60%)
-
-
Risk Hedge:
-
$1.2B investment in Morocco phosphate JVs
-
4. 2025 Export Projections
| Metric | 2024 Baseline | 2025 Forecast |
|---|---|---|
| Total Value | $8.5B | $9.8B (+15%) |
| Volume | 16.7 MMT | 19.2 MMT |
| Average Price | $509/t | $510/t |
5.Critical Uncertainties
-
Geopolitical Risks:
-
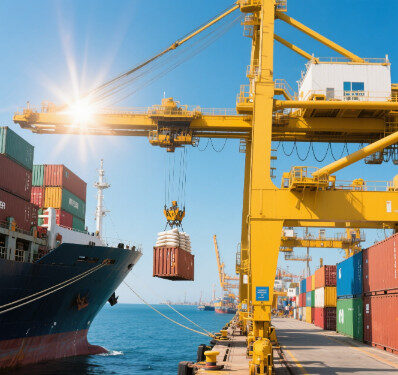
Red Sea shipping disruptions may raise logistics costs by 18-25%
-
-
Technology Leapfrog:
-
India’s nano-urea capacity (440M bottles) could replace 3 MMT traditional urea imports
-
-
Carbon Cost Escalation:
-
CBAM Phase 2 (2026) may increase tariffs to 30% for non-decarbonized producers
-