
The price disparity of NPK 15-15-15 compound fertilizers is often perplexing to farmers and agronomists. Although all products have the same nutrient ratios, prices can vary significantly. This article aims to explain the underlying reasons for these differences by exploring the roles of raw materials, production technologies, hidden quality parameters, and sustainability implications. Understanding these dynamics empowers agricultural professionals to make informed choices that balance cost, efficacy, and environmental stewardship.
1. Raw Material Selection: The Foundation of Cost Variation
The choice of raw materials is the primary cost driver, accounting for 60-70% of production expenses. Key differences lie in nutrient sources:
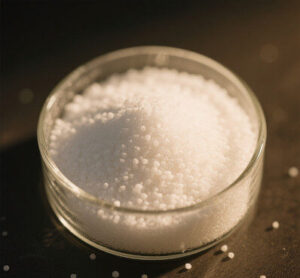
- Nitrogen sources: Premium options include urea (N ≥ 46%), which offers a high concentration but costs 25-30% more than economical sources like ammonium sulfate (N ≥ 20.8%). Urea’s popularity stems from its efficiency; however, its biuret content (up to 1.4% in high-tower granulation) can harm seedlings. Other nitrogen sources include ammonium bicarbonate (N ≥ 17.5%) and ammonium nitrate (N ≥ 34.6%).
- Phosphorus sources: Monoammonium phosphate (MAP) (P₂O₅ ≥ 40%) has superior water solubility, but it costs three times more than single superphosphate (SSP) (P₂O₅ ≥ 12%). While SSP is cheaper, its lower water-soluble phosphorus content reduces its immediate availability to plants. Triple superphosphate (P₂O₅ ≥ 40%) and diammonium phosphate (P₂O₅ ≥ 38%) are also used.
- Potassium sources: Potassium sulfate (SOP) (K₂O ≥ 54%) costs 40% more than potassium chloride (MOP) (K₂O ≥ 63%) due to its chloride-free nature. Despite the higher costs, chloride-sensitive crops (e.g., potatoes, tobacco) necessitate SOP.
Illustrative Cost Comparison (Based on 2025 Global Averages):
- A blend using urea, MAP, and SOP costs approximately $180/ton more than ammonium sulfate, SSP, and MOP.
- Urea (vs. ammonium sulfate) adds $50-$60/ton to production costs.
- MAP (vs. SSP) adds $90-$100/ton.
- SOP (vs. MOP) adds $30-$40/ton.
2. Production Processes: Technology’s Impact on Cost and Performance
Manufacturing methods influence efficiency, quality, and environmental impact:
- High-Tower Granulation (molten slurry at 180-200°C):
- Pros: – Low moisture (<1%), rapid dissolution, glossy appearance.
- Cons: high energy costs ($35-$40/ton), limited to high-N formulations, biuret risks (up to 1.4%).
- Capital investment: $8 million for a high-tower facility.
- Rotary Drum Granulation (steam-assisted agglomeration):
- Pros: Low capital investment ($1.2 million), flexible formulations.
- Cons: Moisture content (3-5%) leads to caking, and nutrient segregation reduces efficiency by 15-20%.
- Ammoniation Granulation (chemical reaction with NH₃):
- Pros: 95% water-soluble phosphorus (P), minimal chloride residue.
- Cons: HCl scrubbing adds $12-$18 per ton in environmental compliance costs.
- Bulk Blending (BB) (physical mixing):
- The lowest cost ($8-$10/ton), but precise particle matching is required to prevent segregation.
Market Share by Technology (Global, Estimation for 2025):
- High-tower: 40% (dominant in premium markets)
- Rotary drum: 45% (popular in mid-range products)
- Ammoniation: 10% (used for specialized blends)
- Bulk blending: 5% (low-value regions)
3. Hidden Quality Parameters: Beyond the NPK ratio:
- Price differences often reflect unlabeled attributes that are critical for performance:
- Water-Soluble P: Ranges from 70% (SSP-based) to 95% (ammoniated). Lower solubility reduces fertigation efficiency.:Salt index: SOP-based blends have a salt index of 46, while MOP-based blends have a salt index of 116. This affects soil salinity, which is crucial for arid regions.
- Biuret content: Controlled processes achieve <0.8%, whereas tower granulation achieves ≤4%. High biuret content can harm germination.
- Granule strength: Tower granules (>30N) resist breakage during storage, whereas rotary drum granules (<15N) do not.
- Chloride Content: MOP-based products contain ≥45% chloride and are therefore unsuitable for sensitive crops.
- Market Segmentation and Crop-Specific Choices
Fertilizers are tiered by composition and target crops:
| Tier | Typical Composition | Price Premium | Target Crops |
| Premium | Urea + MAP + SOP | $50-80/ton | Horticulture, high-value crops |
| Mid-Range | Urea + SSP + MOP | $20-30/ton | Field crops (corn, wheat) |
| Economy | Ammonium sulfate + SSP + MOP | Baseline | Low-value cereals in well-managed systems |
Regional Trends (2025):
- North America and Europe: 65% premium/mid-range products (driven by sustainability and crop quality).
- Asia-Pacific: 55% mid-range and 35% economy (balancing cost and yield).
- Africa and Latin America: 70% economy blends (price-sensitive markets).
5. Sustainability Considerations: Balancing Efficiency and Environmental Impact
As global agriculture faces pressure to reduce its ecological footprint, fertilizer selection must consider the following:
- Nutrient Use Efficiency (NUE): Premium products, such as ammoniated granules, offer 18-25% higher NUE, which offsets the initial costs through reduced waste and increased yields.
- Greenhouse gas emissions:
- Urea production emits approximately 2.5 tons of CO₂ equivalent per ton (vs. ammonium sulfate, which emits approximately 1.2 tons of CO₂ equivalent per ton).
- High-tower granulation adds approximately 0.8 tons of CO₂ equivalent per ton due to energy intensity.
- Long-Term Soil Health: Retention of organic matter in premium blends improves soil structure by approximately 20% over five years.
6. Strategic Selection Guidelines
Farmers should prioritize these tests over NPK ratios:
- Water Solubility Test: This is especially important for phosphorus (ideal for fertigation if ≥85%).
- Chloride screening: Critical for sensitive crops (e.g., tobacco and potatoes).
- Biuret certification: Mandatory for seedling/transplant applications.
- Granule Crush Test: Hardness of >25N ensures storage stability.
Conclusion: The True Cost of Efficiency
The price disparity of 15-15-15 fertilizers reflects nutrient bioavailability, manufacturing sustainability, and operational liabilities. Higher-priced ammoniated/SOP-based products deliver a higher NUE (18-25%), which offsets costs through increased yield. For commodity crops, rotary drum blends are a viable economic option when storage constraints are managed properly. As global fertilizer standards tighten (e.g., biuret limits of less than 1.0%), process innovation will increasingly dictate value propositions. Making an informed selection requires balancing short-term costs with long-term agronomic and environmental impacts.
Data sources: FAO Fertilizer Price Monitor (2025), International Fertilizer Association (IFA) reports, and regional agricultural surveys.